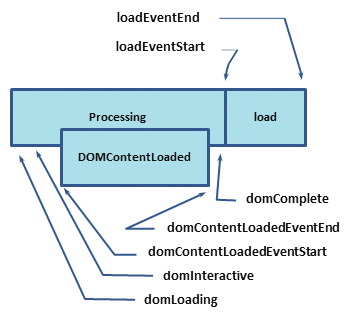
The foundation of every solid performance strategy is good measurement and instrumentation. Turns out, that is exactly what the Navigation Timing API provides.

Each of the labels in the above diagram corresponds to a high resolution timestamp that the browser tracks for each and every page it loads. In fact, in this specific case we’re only showing a fraction of all the different timestamps — for now we’re skipping all network related timestamps, but we’ll come back to them in a future lesson.
So, what do these timestamps mean?
-
domLoading:
this is the starting timestamp of the entire process, the browser is about to start parsing the first received bytes of the HTML document.
-
domInteractive:
marks the point when the browser has finished parsing all of the HTML and DOM construction is complete.
-
domContentLoaded:
marks the point when both the DOM is ready and there are no stylesheets that are blocking JavaScript execution - meaning we can now (potentially) construct the render tree.
-
Many JavaScript frameworks wait for this event before they start executing their own logic. For this reason the browser captures the
EventStart
and
EventEnd
timestamps to allow us to track how long this execution took.
-
domComplete:
as the name implies, all of the processing is complete and all of the resources on the page (images, etc.) have finished downloading - i.e. the loading spinner has stopped spinning.
-
loadEvent:
as a final step in every page load the browser fires an “onload” event which can trigger additional application logic.
The HTML specification dictates specific conditions for each and every event: when it should be fired, which conditions should be met, and so on. For our purposes, we’ll focus on a few key milestones related to the critical rendering path:

