This page discusses how to review summary information, usage data, and operation logs for your Google Cloud SQL instance in the Google Developers Console .
Contents
Viewing instance summary information
You can view summary information about your Google Cloud SQL instances in the Overview pane for each instance in the Google Developers Console . Summary information for an instance includes the instance ID, region, storage used, size (tier), pricing plan as well as other properties.
To view summary information:
- Go to the Google Developers Console and select a project by clicking on the project name.
- In the sidebar on the left, click STORAGE , and then click Cloud SQL to show a list of Cloud SQL instances for the project.
-
Select an instance to view by clicking the instance name.
Developers Console displays the Overview pane for the instance.
Viewing instance usage data
Google Cloud SQL provides usage charts of key instance metrics that you can use to monitor your instances. Rendered charts do not refresh automatically; when you are ready to look at new data, refresh the page. Note that there is a delay of a few minutes between when metric data is recorded and the time it is displayed in the usage charts.
To view instance usage information:
- Go to the Google Developers Console and select a project by clicking on the project name.
- In the sidebar on the left, click STORAGE , and then click Cloud SQL to show a list of Cloud SQL instances for the project.
-
Select an instance to view by clicking the instance name.
The Developers Console displays the Overview pane for the instance.
- In the metric selection box, select a metric to view its usage chart.
The usage charts can help you respond proactively as your application needs change. From these metrics, you can gain insight into issues of throughput and latency as well as instance usage costs. A list of metrics is shown in Table 1.
| Metric | Description |
|---|---|
| Storage Usage (GB) |
You can use the storage usage metric to help you manage your storage costs. For example, for a package billing plan, Google Cloud SQL provides some storage for free for each tier after which storage usage incurs a charge. For both the per use plan and package billing plans, the maximum allowed storage for an instance is 500GB. For more information about storage usage charges, see Pricing . A newly created database uses about 270 MB for system tables and InnoDB logs. |
| Number of Read/Write operations |
The Number of Reads metrics is the number of read operations served from disk that do not come from cache. You can use this metric to help manage your instance costs. Cloud SQL caches data in memory to serve your queries efficiently and to minimize the number of I/O requests. For the package billing plan, each tier has a quota of free I/O operations. Use over the quota is charged. For the per use billing plan, Cloud SQL charges a flat rate for I/O operations. For both plans, you can increase the size (tier) of your instance to serve more requests from cache and reduce costs associated with I/O operations. The Number of Writes is the number of write operations to disk, also included as charged I/O operations. |
| Egress Bytes (GB) | Use the Egress Bytes metric to help manage your instance costs due to external, outbound traffic. |
When working with metric data, keep the following in mind:
- A data point for a metric is an aggregate over all of the databases hosted by the instance.
- Data is reported in Coordinated Universal Time (UTC).
Figure 1 points out the different parts of a usage chart.
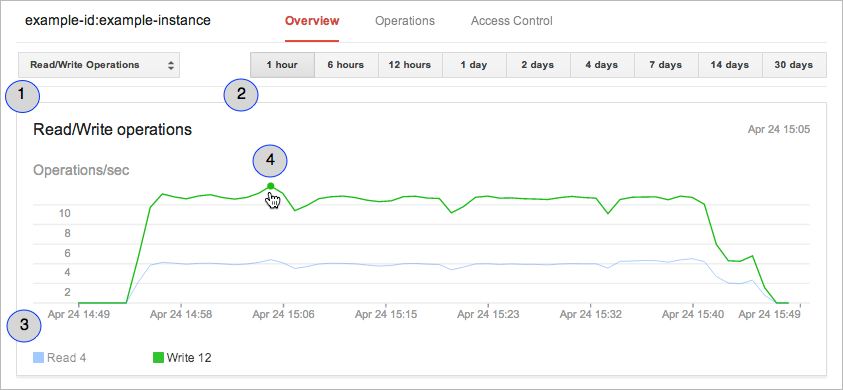
where
- Callout 1: The metric data displayed in the chart.
- Callout 2: The time range for which to view the metric data.
- Callout 3: The value of the metric at the cursor.
- Callout 4: The data cursor. Use the cursor to find the value of a metric at a specific time.
Viewing instance operations log
You can view the logs for an instance in the Operations pane. The Operations pane logs every operation performed on the instance with the following information:
- The time the operation completed, reported in the UTC -7 time zone.
- The type of operation, including "Backup", "Create", "Export", "Import", "Restart", and "Update".
- The status of the operation, either "Done" or "Running".
- A message describing the outcome the operation. If the operation fails, you can use the message to troubleshoot the problem.
To view an instance operations log:
- Go to the Google Developers Console and select a project by clicking on the project name.
- In the sidebar on the left, click STORAGE , and then click Cloud SQL to show a list of Cloud SQL instances for the project.
-
Select an instance to view by clicking the instance name.
The default view is the Overview view of the instance.
- Click Operations to change to the pane showing the operation log.