The Java SDK includes the Appstats library used for profiling the RPC ( Remote Procedure Call ) performance of your application. An App Engine RPC is a roundtrip network call between your application and an App Engine Service API . For example, all of these API calls are RPC calls:
-
Datastore
calls such as
DatastoreService.get(),DatastoreService.put(), orDatastoreService.query(). -
Memcache
calls such as
MemcacheService.get(), orMemcacheService.getAll(). - URL Fetch calls.
- Mail calls.
Optimizing or debugging a scalable application can be a challenge because numerous issues can cause poor performance or unexpected costs. These issues are very difficult to debug with the usual sources of information, like logs or request time stats. Most application requests spend the majority of their time waiting for network calls to complete as part of satisfying the request.
To keep your application fast, you need to know:
- Is your application making unnecessary RPC calls?
- Should it cache data instead of making repeated RPC calls to get the same data?
- Will your application perform better if multiple requests are executed in parallel rather than serially?
The Appstats library helps you answer these questions and verify that your application is using RPC calls in the most efficient way by allowing you to profile your RPC calls. Appstats allows you to trace all RPC calls for a given request and reports on the time and cost of each call.
(For more information about managing application cost, see the Managing Your App's Resource Usage article.)
Contents
Setup
There is nothing to download or install to begin using Appstats. You just need to configure your application, redeploy, and access the Appstats console as described in the steps below. The Appstats library takes care of the rest.
1. Install the event recorder
Appstats gathers information about each request using a servlet filter, a class provided by the SDK. You install the filter on requests you wish to monitor by adding
<filter>
and
<filter-mapping>
elements to your
deployment descriptor
(
web.xml
).
To install the servlet filter, add a section similar to the following in the top-level element of your
web.xml
file:
<filter>
  <filter-name>appstats</filter-name>
   <filter-class>com.google.appengine.tools.appstats.AppstatsFilter</filter-class>
</filter>

<filter-mapping>
  <filter-name>appstats</filter-name>
  <url-pattern>/*</url-pattern>
</filter-mapping>
This installs the filter for all URLs, with the
<url-pattern>
of
/*
. (This includes the Appstats web-based console discussed below, which you may prefer to exclude from recording.) You can specify a different pattern to limit Appstats to URLs that match the pattern.
2. Set the console path
The Appstats console is accessed by visiting a URL for your application in a web browser. You set up this console as part of your application, using a servlet class provided by the SDK.
To set up the console at the URL path
/appstats/
, secured so that only application administrators can access it, add the following in the top-level element of your
web.xml
file:
<servlet>
  <servlet-name>appstats</servlet-name>
  <servlet-class>com.google.appengine.tools.appstats.AppstatsServlet</servlet-class>
</servlet>

<servlet-mapping>
  <servlet-name>appstats</servlet-name>
  <url-pattern>/appstats/*</url-pattern>
</servlet-mapping>

<security-constraint>
  <web-resource-collection>
    <web-resource-name>appstats</web-resource-name>
    <url-pattern>/appstats/*</url-pattern>
  </web-resource-collection>
  <auth-constraint>
    <role-name>admin</role-name>
  </auth-constraint>
</security-constraint>
3. Optional configuration
Custom console
You can use
Administration Console Custom Pages
to add a convenient Appstats console link on the Administration Console. To create a custom link named "Appstats" to the default Appstats console path, add the following in the top-level element of your
appengine-web.xml
file:
<admin-console>
  <page name="Appstats" url="/appstats" />
</admin-console>
Logging
The
AppstatsFilter
class can be configured to write request-specific information to
application logs
. To enable this logging, modify the
filter
element created in
step 1
to include the
logMessage
parameter:
<filter>
  <filter-name>appstats</filter-name>
  <filter-class>com.google.appengine.tools.appstats.AppstatsFilter</filter-class>
  <init-param>
    <param-name>logMessage</param-name>
    <param-value>Appstats available: /appstats/details?time={ID}</param-value>
  </init-param>
</filter>
The text value of
param-value
is appended to the log for each request processed by the filter, with
{ID}
replaced by the ID of the request. The text in this example provides a path to the Appstats details for the request.
These log entries are written at the "INFO" level, so you must also set the log level to "INFO". This can be set specifically for the
AppstatsFilter
class by adding the following to your
logging.properties
file:
com.google.appengine.tools.appstats.AppstatsFilter.level = INFO
Displaying cost
AppStats can keep track of RPC
cost
as well as time. If your application is fast enough but more expensive than you expect, look for operations that cost more than you expect. To turn on cost tracking, set the
calculateRpcCosts
parameter of your
appstats
filter to
true
:
<filter>
  <filter-name>appstats</filter-name>
  <filter-class>com.google.appengine.tools.appstats.AppstatsFilter</filter-class>
  <init-param>
    <param-name>calculateRpcCosts</param-name>
    <param-value>true</param-value>
  </init-param>
</filter>
Public access
By default, only authenticated application administrators can access the Appstats console. To allow public access to the console, you must do two things:
-
Modify the
servletelement for theAppstatsServletclass created in step 2 to include therequireAdminAuthenticationparameter set tofalse:<servlet> <servlet-name>appstats</servlet-name> <servlet-class>com.google.appengine.tools.appstats.AppstatsServlet</servlet-class> <init-param> <param-name>requireAdminAuthentication</param-name> <param-value>false</param-value> </init-param> </servlet> -
Remove the
security-constraintelement created in step 2 .
4. Test Appstats from the development server
You can test your Appstats setup with the development server:
- If you are using Eclipse, and have not changed the default port, access the console at: http://localhost:8888/appstats/ .
-
If you are using the
dev_appservercommand to start the server, and have not changed the default port, access the console at: http://localhost:8080/appstats/ .
5. Deploy
Once you are satisfied with your Appstats setup, deploy your application. Access the console at
http://your_app_id.appspot.com/appstats
.
A tour of the Appstats console
The Appstats Console provides high-level information on RPC calls made, URL paths requested, a history of recent requests, and details of individual requests:
-
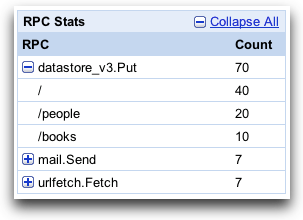
The RPC Stats table shows statistics for each type of RPC made by your application. Clicking a plus button expands the entry to show a breakdown by path request for the RPC:
-
The Path Stats table shows statistics for each path request sent to your application. Clicking a plus button expands the entry to show a breakdown by RPC for the path request:
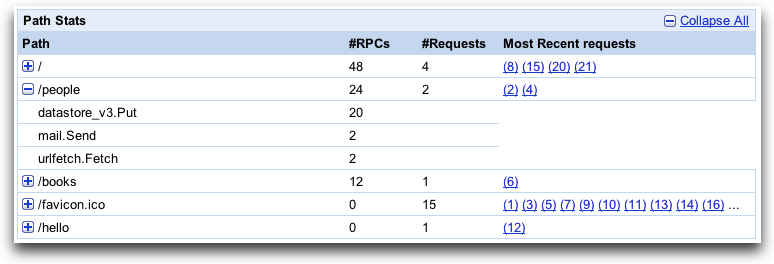
If you have enabled the API cost tracking feature, this will also display costs.
-
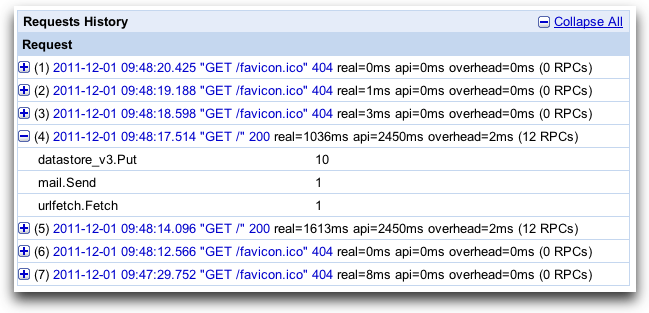
The Requests History table shows data pertaining to individual requests. Clicking a plus button expands the entry to show a breakdown by RPC. Clicking on a request link shows a timeline for the request including individual RPC timing:
-
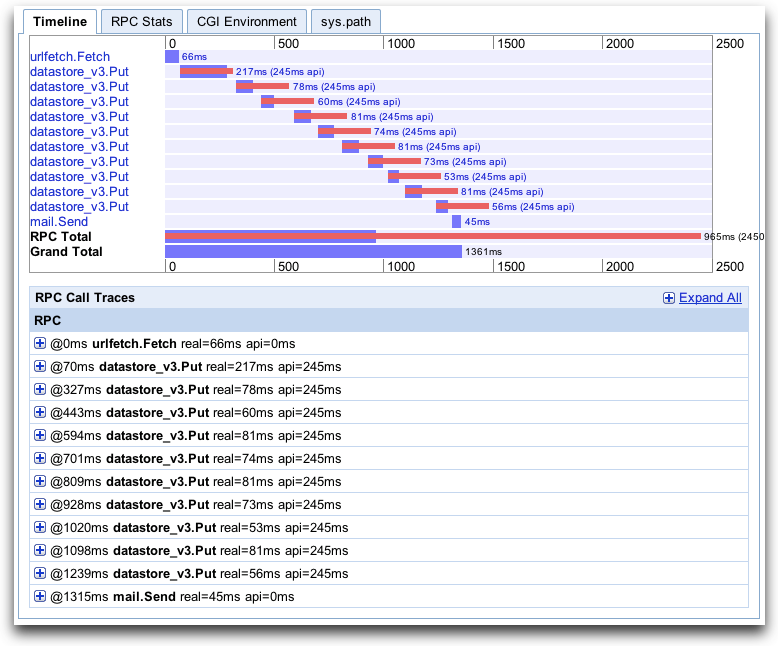
The RPC Timeline graph shows when specific RPC calls were made and how long the requests took to process. The RPC Total bar shows the total time spent waiting on RPC calls, and the Grand Total bar shows total time spent processing the request. As you can see from the timeline below, the majority of time was spent on RPC calls. This is often the case. The other tabs show additional information about the request. Understanding the impact of RPC calls on your application response time is invaluable when analyzing its performance.
How it works
The Appstats servlet filter adds itself to the remote procedure call framework that underlies the App Engine service APIs. It records statistics for all API calls made during the request handler, then stores the data in memcache, using a namespace of
__appstats__
. Appstats retains statistics for the most recent 1,000 requests (approximately). The data includes summary records, about 200 bytes each, and detail records, which can be up to 100 KB each.
The Java version of Appstats uses fixed values and behaviors for how data is stored in the memcache and the datastore. (These cannot be configured as they can with the Python version of Appstats.)
Speed Tracer integration
Appstats data can be incorporated in the Speed Tracer Google Chrome extension. Using Speed Tracer and Appstats together gives you a consolidated view of both client-side and server-side performance. Follow the steps on the Speed Tracer Server-Side Tracing page.