This article was written and submitted by an external contributor. The Google App Engine team thanks Christopher O'Donnell for his time and expertise.
Christopher O'Donnell ( @markitecht )Technology product designer and developer from Cambridge, Massachusetts
August 2010
Modern Funnel Analytics Using the Mapper API
The announcement of the Mapper API at Google I/O 2010 was a welcome one to the community, to say the least. The Mapper API represents a big step toward being able to boil down significant amounts of data into reports efficiently, in addition to scores of other types of parallel manipulation of large data sets. Though the 'reduce' component of the traditional Map/Reduce recipe remains to be built, there are already many compelling uses for this exciting library.
One problem space that immediately called out for a Map/Reduce-based solution was the area of online marketing analytics, specifically multi-step conversion tracking, also known as funnel analytics. My goal was to track the life cycle of each user, ultimately tying the average 'value' of different types of users to my advertising spend in AdWords . What other tools lacked, was the ability to see multi-level outcomes for users who first came to our site within a specific time period.
Here is a snapshot of the kind of report I wanted to be able to produce:
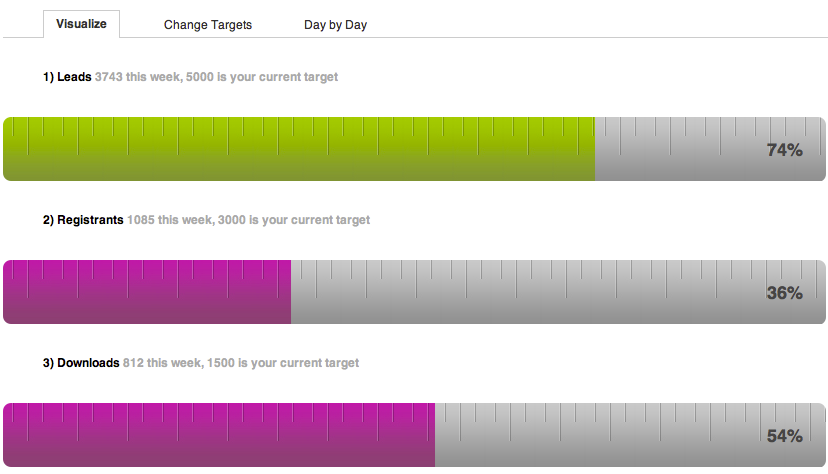
Note: For clarity this sample report only shows the first three steps of the funnel. Also, the production system is able to support much larger data sets and targets than shown above.
Requirements and Insights
My requirements were:
- provide weekly snapshot reports
- allow drill-down to see daily performance
- provide a mechanism to set targets for each step, in order to scale my funnel visualization to represent relative, not absolute, performance
To deliver the relative performance numbers, my third requirement, I simply need to allow the user to enter historically realistic target values for each step in the funnel process. I then scale the resulting visualization to the provided target values.
The key insight to addressing the first two requirements is that having daily statistics amounts to having weekly statistics, since summing daily numbers gives us weekly numbers:

In order to produce daily numbers, which will feed into the weekly numbers, we can sum hourly data:

Secret Sauce
You might be wondering at this point why we simply don't determine the daily statistics on demand. In order to determine the number of conversions in any given step of the funnel, we have to count. However, we're limited to how many entities we can practically count in a single query or in a single request. For example, if we were to count up to, say, 1,500 entities per query, then, in any given time period, we could count at most 1,500 visitors. In other words, if we tried to determine daily visitor counts on demand, our system would be limited to tracking about 45,000 unique visitors a month (30 days x 1,500 / day)
I want to support around 500,000 monthly visitors, with room to grow in the future. To achieve this, I count the number unique visitors in each hour, allowing the system to count well over 500,000 monthly visitors (30 days x 24 hours x 1,000 / hour). To support even more visitors, I could count at a finer grained time period. For example, counting unique visitors at a ten second interval would support over 250 million monthly visitors.
The secret sauce is to not iterate over all the entities which represent unique visits to the site, but rather, map over a set of entities which represent time slices. As we map over each time slice entity we count the number of unique visitor in that time slice, updating the entity counter as we go.
Implementation
First, we must create these time slice entities ahead of time, so that the Mapper API will have entities to map over. There are many ways to do this. I chose the first that came to mind, which is simply to use a cron job to ensure that Hour, Day and Week time slice entities are created before the Mapper runs. Here's an example of a cron handler, which is set to run every 30 minutes, that creates
Hour
entities for a trailing 24-hour period.
class EnsureHoursExist(webapp.RequestHandler):
def get(self):
    today = datetime.datetime.today()
    for hour in range(24):
        val = today - datetime.timedelta(hours=hour)
        # Ensure the existence of, or trigger the creation of any missing Hour entities
        # This, and any similar entitiy creation methods, must be idempotent
        get_or_create_hour(val)
All time slice classes extend my
Slice
class, which itself extends db.Model:
class Slice(db.Model):
    value = db.DateTimeProperty()
    leads = db.IntegerProperty(default=0)
    registrants  = db.IntegerProperty(default=0)
    downloads = db.IntegerProperty(default=0)
    # ... additional funnel steps here ...
Once all the time slice entities are prepared, it's time to run the Mapper job to populate the empty slices with up-to-date counts. For background on how to add the Mapper API to your app and get started with defining and running jobs, read the excellent documentation provided by the team.
Note: It's important to ensure that all your tasks are idempotent , because tasks may execute more than once. To build my Hour statistics, my Mapper job handler looks like the following code snippet.
def build_hourly_stats(hour):
    start = hour.value
    end = start + datetime.timedelta(hours=1)
    hour.leads = count_all_leads(start, end)
    hour.registrants = count_registrants(start, end)
    hour.downloads = count_downloads(start, end)
    # ... additional funnel steps counted here ...

    # Use yield here as Mapper is iterating over all Hour entities
    # Actual datastore transactions will be performed in bulk mutations automatically
    yield op.db.Put(hour)
If the yield statement is unfamiliar to you, you can check out the Python generator documentation and yield statement documentation , or read this useful explanation .
You'll notice I've factored out my counting helper functions; here's an example of one:
def count_registrants(start, end):
    return Lead.all().filter('created >=', start).filter('created <=', end).filter('registered', True).count()
Once the
Hour
entities have been updated by the Mapper job to create 'Hour' statistics, I run Mapper jobs to summarize 'Day,' and then 'Week' statistics. Through each subsequent iteration, this approach requires no additional counting of the original entities, and is therefore extremely fast, regardless of how many visitor entities were counted in the first iteration.
Conclusion
Thanks to the App Engine team for inviting me to share my experience using Mapper to build multi-stage conversion reports. I hope some of these approaches are applicable to your projects!