The Admin Console dashboard has charts that give you a quick visual reference of your system usage. The information shows various snapshots of resource utilization and performance statistics over different time periods depending on the particular chart. Two pulldown menus above the charts let you filter the information by application module and version names:
These are the available charts:
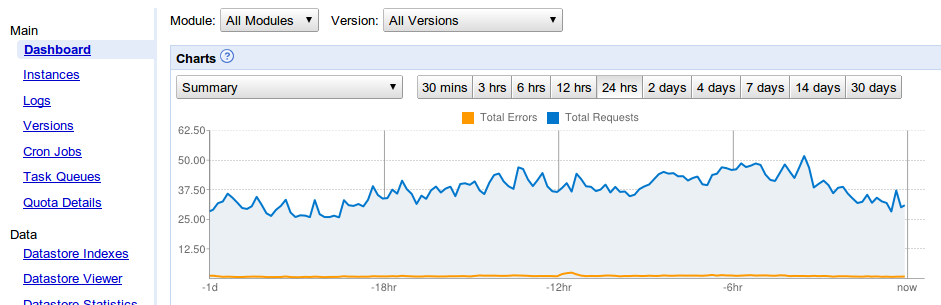
- Summary
-
- Total Requests : The number of URIs requested from your application every second, including dynamic, static, and cached requests.
- Total Errors : The number of errors generated by your application every second.
- Requests by Type (Queries/Second)
-
- Static Requests .
- Dynamic Requests .
- Cached Requests (served from the cache).
- Latency
-
The average number of milliseconds your application takes to service a request (latency measure), including only dynamic requests. Includes the time it takes to process the request, but not the time it takes to deliver the request to the client.
- Loading Latency
-
The average number of milliseconds your application takes to respond to its first request (latency measure). This will include loading and initializing the app. Includes the time it takes to process the request, but not the time it takes to deliver the request to the client.
- Error Details
-
- Total Errors : The number of errors generated by your application every second.
- Quota Denials : The number of times a request to your application was denied due to exceeding quotas; see Quotas for a complete overview.
- DoS API Denials : The number of requests detected (and blocked by App Engine) as DoS attacks against your application.
- Traffic (Bytes/Second)
-
- Sent : The number of bytes sent by your application every second, summed across all requests.
- Received : The number of bytes that are received by your application every second, summed across all requests.
- Utilization
-
- Total CPU : The amount of CPU megacyles your application uses every second.
- API Calls CPU : The amount of CPU megacycles your application uses every second to call Google APIs.
- Milliseconds Used/Second
-
The number of milliseconds per second your app is handling a request.
- Instances
-
- Total : Count of live instances.
- Active : Count of live instances currently in use.
- Billed : Count of live instances that have enabled billing.
- Memory Usage (MB)
-
Combined memory usage of your app's instances.
- Memcache Operations/Second
-
The rate of memcache key operations. For batch requests, each item in the batch counts as a key operation.
- Memcache Traffic (Bytes/Second)
-
- Sent : The volume of data sent to memcache.
- Total : The combined values of sent and received.
- Received : The volume of data received from memcache.
- Memcache Compute Units/Second
-
A metric that approximates the resource cost of memcache as a function of the characteristics of each request (value size, read vs. mutation, etc.).
- Memcache Total Cache Size (MB)
- The cache is shared by all modules and versions in an app. This chart is not available if you've used the module and filter menus to display information for a specific module and/or version.